
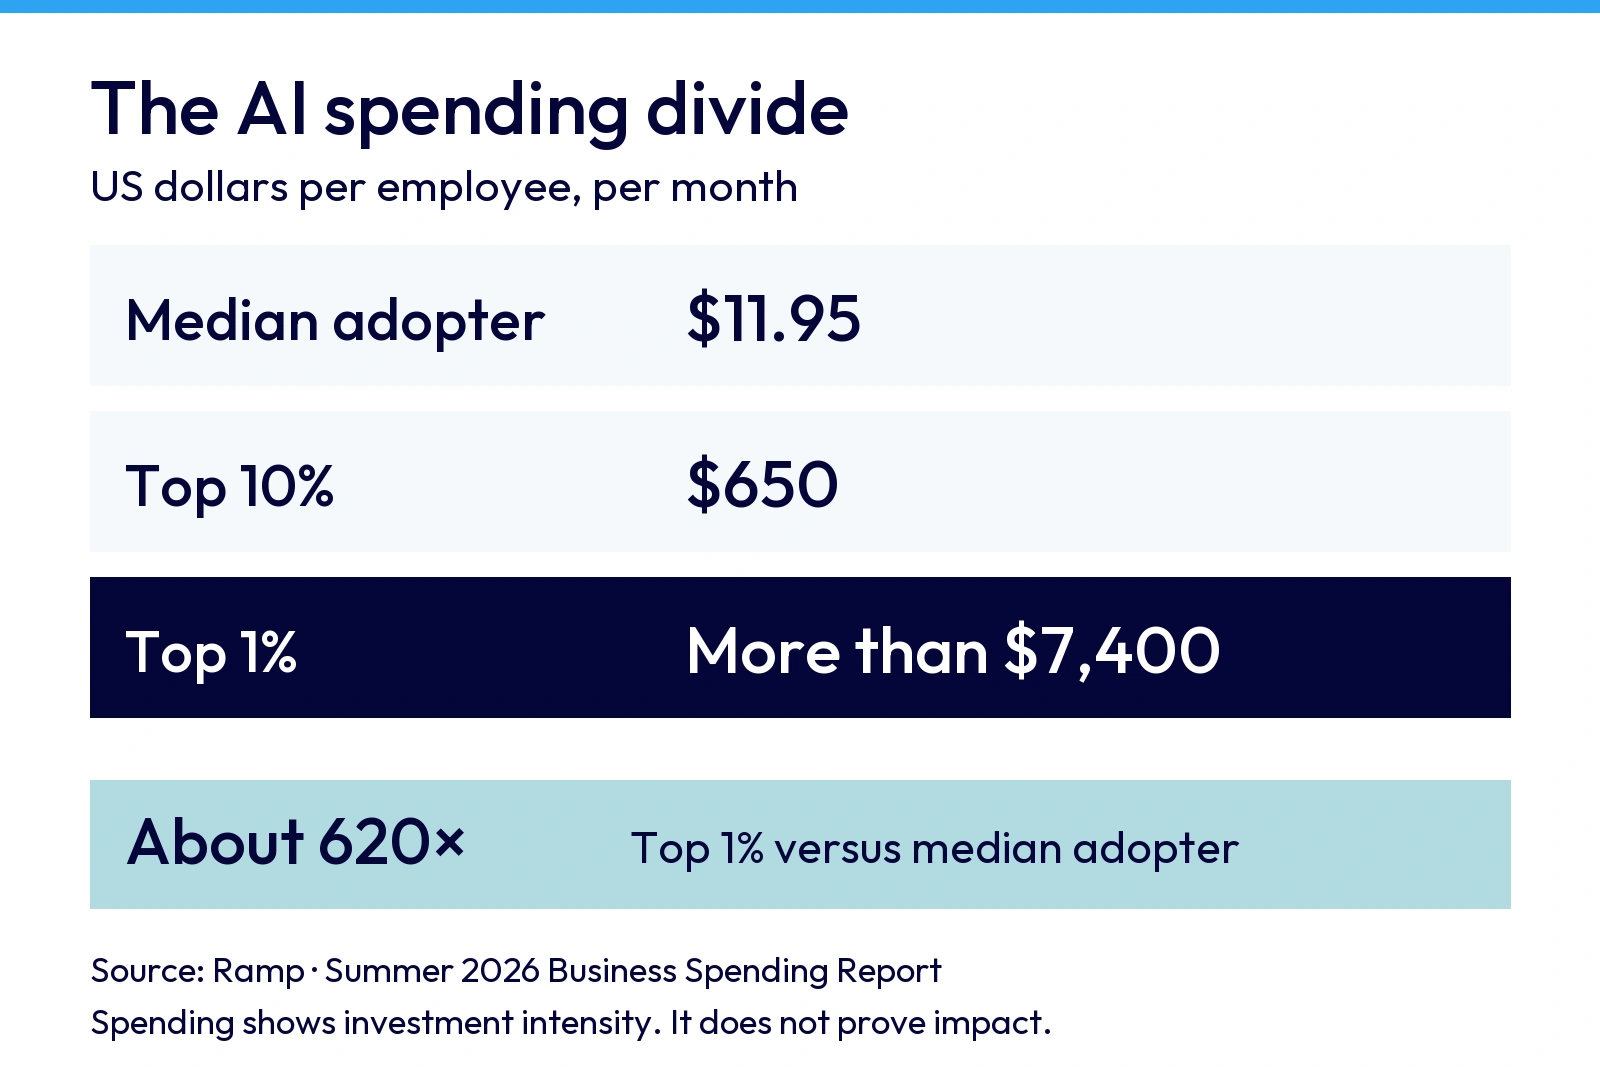
Then the spending figures reveal a much bigger divide:
- The top 1% spends more than $7,400 per employee per month.
- The top 10% spends $650.
- The median adopter spends only $11.95.
That means the top 1% spends roughly 620 times more per employee than the median adopter.
The distance between those figures is extraordinary. It also raises a more important question: what does AI spending actually tell us?
Purchases provide evidence that organizations have crossed the threshold from curiosity to paid access. Spending intensity can also indicate that AI is being used across more tools, workloads or technical systems. But neither figure can tell us whether employees use AI regularly, whether they use it well, whether recurring workflows have changed, or whether performance has improved.
In other words,
You cannot ask one AI adoption metric to answer five different management questions.
This is where many AI dashboards become misleading. They combine access, usage, skill, workflow change and performance under one heading, then report a single adoption percentage as if all five moved together.
They rarely do.
One Adoption Number, Five Different Questions
A clearer view begins by separating five layers: Access, Activity, Capability, Integration and Impact. These layers will form a fuller Radiant Institute framework later. For now, the examples below show why the distinction matters.
Access: Is Useful AI Available to People?
Imagine an organization buys an enterprise AI license for every employee. Procurement reports strong adoption because access has been provided across the workforce.
Yet some employees may not know which tool to use, which features are available, what information is permitted, or whether the approved platform can handle their actual work. Others may be restricted to a basic tier while a smaller group has access to more capable models, premium features, APIs or agents.
In other words, the company has opened the door. We still do not know whether anyone is walking through it.
Activity: Is AI Becoming Part of Regular Work?
Employees begin prompting. Weekly active-user figures rise. Message counts look healthy.
But consider three employees who all use AI every day. Faruk asks it to polish emails and check grammar. Selvi uses it to analyze hundreds of customer comments, identify recurring causes and prepare evidence for a service review. John uses it to find new lunch spots.
All three count as active users. Their activity has very different consequences for the work.
And frequency can mislead too. Selvi might run that analysis only once a month, yet it could matter more to the business than Faruk’s daily prompts.
Activity tells us how often AI is used. It cannot tell us whether that use is relevant, valuable or effective.
Capability: Can People Use AI Effectively?
Two people can use the same tool at the same frequency and produce very different results.
One accepts the first polished response. The other provides useful context, challenges assumptions, checks sources, improves the instructions and knows when human judgment must take over.
The difference will not appear in a login report. It becomes visible in the quality of the work, the decisions made around it and the amount of repair required afterwards.
This is where AI adoption becomes a human capability question.
Access tells us what people have. Activity tells us how often they use it. Capability tells us what they can actually do with it.
Integration: Has the Workflow Changed?
Take the AI meeting assistant as an example. It joins every call, produces a transcript and writes a clean summary with action items.
The meeting still lasts 60 minutes. The same people still attend. Status updates are still delivered live. Decisions still wait until the following week.
AI improved the documentation, but the workflow around the meeting stayed intact. Under the illusion that AI helped the meeting, teams might simply schedule more of them without addressing the core issue: do we really need this meeting?
A team that redesigns the workflow around AI might move status updates into a pre-read, reserve meeting time for decisions and disagreement, narrow attendance to the people with decision rights, and record owners as decisions are made. The tool may be similar. The way work moves can be very different.
Impact: Did Performance Improve?
A department can report thousands of prompts, rising active-user numbers and faster first drafts.
The harder questions come afterwards:
- Did turnaround time improve from request to completed work?
- Did rework fall?
- Did customers receive clearer or faster answers?
- Did managers gain capacity for higher-value decisions?
- Did revenue, cost, quality or risk move in a useful direction?
Impact connects AI-assisted work to a result the organization already cares about. It also requires careful language. AI may contribute to an outcome without being its sole cause.
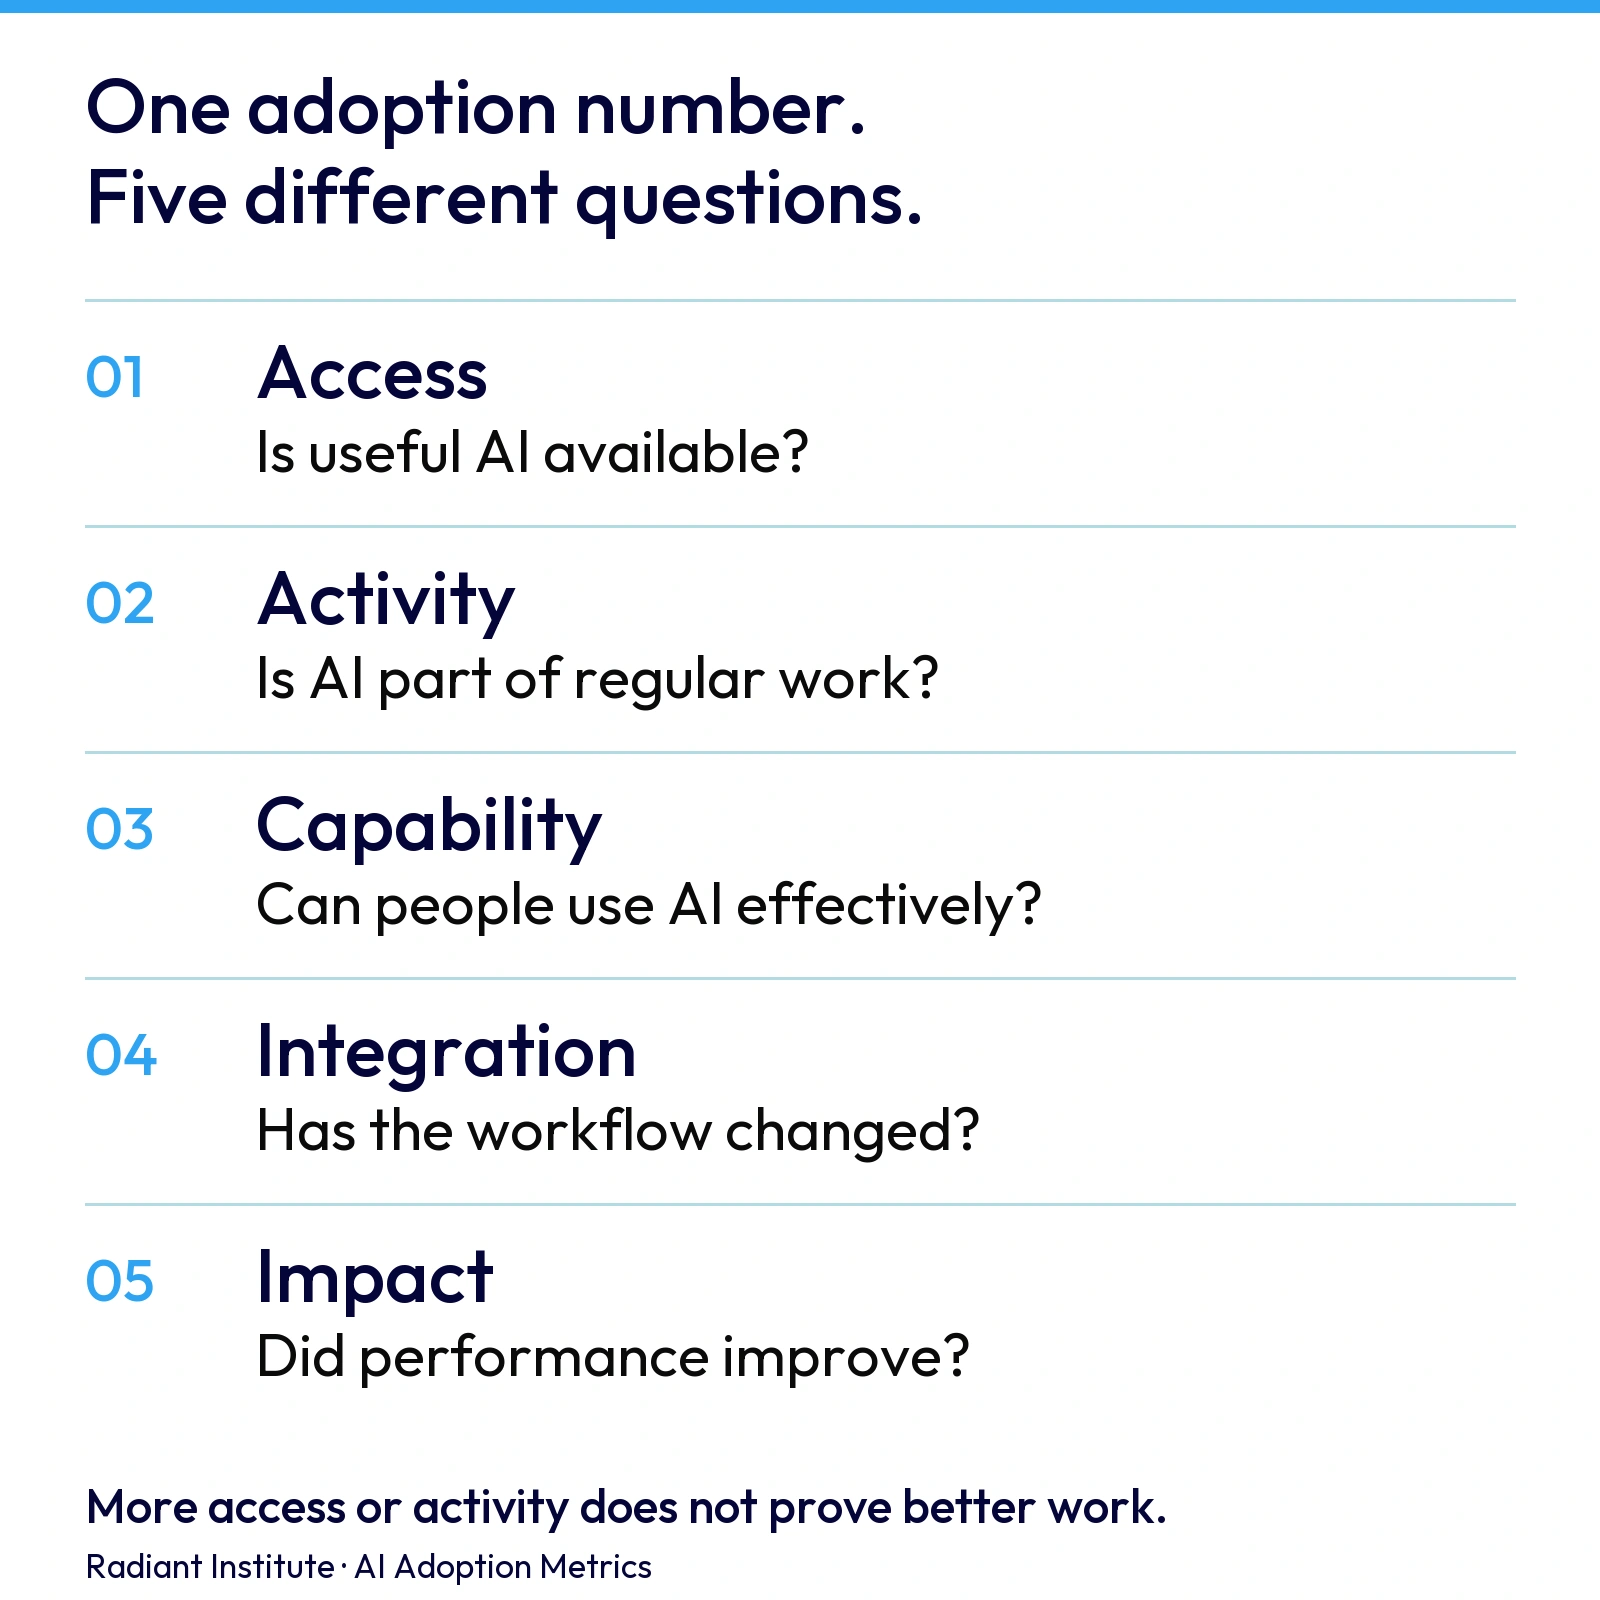
Five questions for reading AI adoption metrics, based on the article’s distinctions.
Why Spending Intensity Can Become a Vanity Metric
Ramp’s spending data is valuable because it gives leaders a firmer signal than declared adoption. High spending may indicate serious experimentation, specialized workloads, broader access or AI embedded deeply into products and operations.
It may also reflect overlapping tools, inefficient prompting, excessive context, repeated regeneration or costly technical workloads that produce limited value.
The pricing model makes this distinction more urgent. Ramp found that a median business billed by usage spends 10.6 times more annually on embedded AI products than one paying only by seats. That does not make usage pricing inherently poor. It means consumption needs to be connected to a result.
A growing AI bill may be justified when it supports better decisions, faster service, cleaner handoffs or new capacity. Without that evidence, intensity risks becoming another impressive number in a dashboard full of them.
When a Measure Changes the Behavior
In the 1970s, economist Charles Goodhart was studying monetary policy at the Bank of England. He noticed that relationships which had looked reliable began to break down once governments used them as control targets.
He expressed the problem this way:
“Any observed statistical regularity will tend to collapse once pressure is placed upon it for control purposes.”
The observation became known as Goodhart’s Law. In plain English, the moment a number becomes a target, people start changing their behavior around the number.
That matters for AI adoption. Set a target for prompt volume, and employees can produce more prompts without producing better work. Set a target for active users, and people can open the tool every week without changing a meaningful task. Set a target for hours saved, and estimates may become more optimistic even when team capacity stays the same.
The dashboard improves. The work may not.
This does not mean leaders should stop measuring. It means every metric needs to be treated as a signal rather than the destination, with enough judgment and supporting evidence to see what is happening behind it.
Implications for Leaders and L&D
- Define the metric before celebrating it. Be precise about whether an adoption figure measures access, activity, capability, workflow change or impact.
- Separate usage from effectiveness. More prompts and more active users may represent progress, but they do not prove better work.
- Connect measurement to decisions. Every metric should help someone decide what to improve, fund, redesign or stop.
Try This This Week
- List every AI number currently reported in your organization, including licenses, active users, messages, spending and time saved.
- Sort each number under Access, Activity, Capability, Integration or Impact. If one number appears to cover several layers, write down what it can genuinely prove.
- Use the Team AI Effectiveness Scorecard to examine the Capability driver, then compare that evidence with your access and usage figures. The gap between them may be more useful than either score alone.
Closing Thoughts
Ramp’s report gives leaders a valuable view of paid access and spending intensity. Those signals help us see how quickly AI purchasing is spreading and how unevenly organizations are investing.
But spending is one piece of a larger management picture.
An organization can provide access without sustained activity. It can have high activity without strong capability. Capable employees can work inside workflows that never change. Redesigned workflows can still struggle to produce measurable performance gains.
That is why AI adoption needs several connected measures rather than one headline percentage.
The immediate task is simple: identify which part of the system each number describes, then be honest about what remains unseen. Once leaders can distinguish access from activity, capability, integration and impact, they can have a much more useful conversation about where their AI investment is going and what needs attention next.
Radiant Institute helps leaders and L&D teams connect AI access with the human capability and work practices required to produce meaningful results. If your adoption dashboard tells you people are using AI but cannot show whether the work is improving, that is a useful place to begin.

Maverick Foo
Lead Consultant, AI-Enabler, Sales & Marketing Strategist

The Supervision Gap: Why Manager AI Training Starts With Practice
Manager AI training often skips the managers themselves. See what OpenAI’s study of 17 million messages reveals about the supervision gap and how to close it.

AI Hall of Mirrors: 5 AI Adoption Gaps Leaders Need to Know
Build an AI workflow that stays reliable as tools change. Learn why continuity matters for multi-step work and what leaders can do.

The AI Specialist Myth: What’s Really Behind the AI Skills Gap
Understand the AI skills gap and what leaders and L&D can do about it, with practical steps to build AI literacy across your entire workforce this quarter.
0 Comments